Dear Friends.
At Constructive, our mission is to use the power of communications, design, and technology to create a more empathetic, equitable, and sustainable world.
For 20 years, we’ve been fortunate to partner with ambitious organizations working at the forefront of social change to advance this mission. For the last few weeks, like many, we’ve been overwhelmed by feelings of anger, sadness, shame, anxiety, and despair.
In thinking about how to respond to recent events, it’s been hard to find words to meet this moment. Words that can do justice to yet another racial injustice and that are worthy of sharing on behalf of our company—a diverse group with different backgrounds and life experiences. As difficult as this is, in a small company like ours, I feel that it is my responsibility as its founder to speak up.
I’ve been taking a close look at myself, my role in Constructive, and at Constructive’s role in helping to build a world that’s aligned with our values. This work started (and continues) with listening, learning, and gaining new perspective.
It’s critical to recognize that anything I say is said from a position of incredible privilege in American society. As a white male, no matter how much I see, listen, believe, and empathize, I will never know what it means to be systematically disenfranchised from the system that I benefit from—benefits accrue to me and all white people at the expense of others because of the color of their skin. To acknowledge this is horrifying. But it is infinitely less horrifying than being forced to live with the pain that white America inflicts on BIPOC America.
When you’ve dedicated your career to working for social change, it’s too easy to give yourself a pass on your position as a white person of privilege in a systemically racist society. How do my choices, how does my very being perpetuate values and policies that nauseate me? If I’m being honest about what change means for me and for Constructive, then seeking truth to difficult questions is a job that will never end. And because of my position in American society, I have a responsibility to do more.
Constructive is an ally of all those who work for racial justice and we will continue to be intentional about the work we do to live our values and help realize a more just and equitable world. Not just the work we do with our clients, because that’s a given, but also with ourselves through our policies, practices, and culture. Our team brings many different perspectives to this work, so I’m confident we’ll make good progress—and I’m excited to see what’s to come. We’ve already taken tangible actions, which I’ll resist sharing because we don’t get to take a victory lap for doing what must be done. And also because, for any action to be meaningful, it must be sustaining.
And for myself, I’ve got my own work to do, which I’ve started: revisiting old texts and seeking out new voices; embracing discomfort so that I can be better and do more. I’m also grateful to have a 12-year-old daughter who my wife and I are focusing our energies on in a family exploration of the issues of race and justice—and of our relationship to them.
I’d like to thank the members of my team who helped me with their feedback on this letter and acknowledge the insightful words of other leaders that have come before me. This is a generational wake-up call. Let’s not let it go to waste.
In humble solidarity,

Matt Schwartz
Founder and Executive Director
______________
For those who are interested, below are some of the voices and resources that Constructive’s team has been seeking out in our efforts to actively promote racial equality.
Navigating Conversations About Race
It can be hard to find the right words to talk about race but they need to be had. The National Museum of African-American History and Culture created an online platform called Talking About Race, offering guidance and resources for educators, parents and caregivers, and anyone committed equity, for preparing for and initiating these challenging and urgent conversations.
It’s Time to Do The Work
Acknowledging our own implicit biases and the ways that we’ve participated in racist power structures is uncomfortable. But understanding how our biases have formed and why those structures exist is the first step in turning discomfort into change. Tasha K. created the Shareable Anti-Racism Guide, a comprehensive list of books, essays and other media to help you get started and encourage others to do so too.
Reframing American Slavery
In order to understand racism in America in 2020, it’s essential to understand the role of slavery in the nation’s origin and rise to global power. In August of 2019, on the 400th anniversary of American slavery, The New York Times published The 1619 Project, an ongoing initiative to examine the role of slavery in American history. The initiative’s creator and lead reporter, Nikole Hannah Jones, won a Pulitzer for her work in May.
Calling White People In
White people who identify as anti-racist have a responsibility to speak out against racism. Showing Up for Racial Justice (SURJ), a national network of individuals and groups organizing white people around racial justice and dismantling white supremacy, compiled a toolkit of best practices, talking points and conversation starters for talking with other white people about the protests, looting and instances of violence between protesters and police.
How to Be a Better Activist
Knowing how best to respond to social issues like racial injustice isn’t always obvious. In some cases, such as the #BlackOutTuesday campaign on Instagram, well-intentioned actions can cause more harm than good. The Effective Activist Guide compiles research on effective social movements and offers guidance on how to make the most impact as an activist, whether you’re just starting out or looking for new things you can do.
A Remedy for Information Overload
The amount of information in the news and on social media can be overwhelming, especially during times of urgency and uncertainty. The Radical Database was created by artist and activist Angelina Ruiz to provide everyone with a diversity of resources to make it easier for everyone promote racial justice—from supporting black-owned businesses, donating to bail funds, to taking care of your mental health.
75 Things White People Can Do for Racial Justice
Acknowledging that “achieving racial justice is a marathon, not a sprint,” Corrine Shutack created this resource in 2017 and continuously updates it to ensure that each item is accurate and needed today. From providing practical civic and social action white Americans can take to push for change to educational resources and recommendations for organizations to donate to, 75 Things White People Can do for Racial Justice does a great job providing pathways to do more.
During our weekly virtual team happy hour, we’ve been swapping stories about how each of our neighborhoods are responding to the COVID-19 Pandemic. In Hoboken, colored pieces of ribbon or paper hang from front doors to indicate the health of the people inside. Front lawns in a small NJ suburb are speckled with signs thanking health care workers. In Manhattan, otherwise deserted blocks erupt with applause every night at 7 pm to thank the essential workers keeping the city safe. These community rituals remind us that even in the face of an unprecedented global crisis, moments of hope, gratitude, and connection persist.
Here at Constructive, it also makes us think about the many public health organizations we’ve had the privilege of working with over the years. COVID-19 has exposed countless weaknesses in our nation’s health and economic system, most notably high costs and the number of uninsured people. For many working in the public health sector, none of these weaknesses came as a surprise. These are the challenges that have motivated their mission for years.
Now feels like as good a time as any to express our deep gratitude for the public health organizations we’ve partnered with, and to highlight their work in response to the crisis.
The Commonwealth Fund
What they do: For over 100 years, the Commonwealth Fund has worked to ensure all Americans have access to quality, affordable healthcare for over 100 years.
COVID Response: The Commonwealth Fund is publishing reports, research, and resources related to COVID-19 and our healthcare system.
The Paraprofessionals Healthcare Institute (PHI)
What they do: PHI supports America’s direct care workforce by promoting quality jobs as the foundation for quality care.
COVID Response: Older communities are at a higher risk for developing COVID-19. The workers primarily responsible for caring for our older neighbors, direct care workers, are on the frontline of this pandemic every day. PHI has been publishing resources and collecting information from members of their network to assist this vital workforce.
Other Response Efforts from Our Partners
The Weizmann Institute is funding scientific research on the virus, and sharing resources and updates .
The Legal Aid Society is open remotely and helping clients cope with legal fallout from the crisis, as well as providing assistance with unemployment and CARES Act Benefits.
The National Headstart Association is publishing resources for parents.
As the days continue to feel more like months, we hope you’ll take heart in the work from our partners and so many more organizations around the world working to fight this virus, and create a more equitable world on the other side. We sure are.
I was facilitating a workshop with a new partner recently and had several ideas for some new articles for the insights section of our website, “Constructive Thinking.” I had to stay present during the workshop, so I made mental notes of each idea with the intention of jotting them down later so that I could bring them to life when the time came to write.
Despite helping nonprofits and social impact organizations develop their brands and design brand experiences for the last twenty years, I’m still learning new things, connecting the dots, and having “aha” moments on a regular basis. This is especially true when we’re engaging directly with partners in the field—whether that’s during a workshop, a site visit, or even on a weekly check-in call—in-the-moment insights that feel as profound as they are fleeting. We learn so much by doing. But we don’t always have the time or bandwidth to articulate the meaningful lessons and experiences that come out of the work we’re so lucky to do. We also realize that we’re not the only ones with less spare time than we’d like—audiences are swamped with content options and may not be able to read a long article, no matter how interesting it looks.
So that’s why we’ve decided to start a new Constructive series, “Field Notes.” Field Notes is our hack to an information-saturated, time-starved world. A way for our team to capture and quickly share important learnings, ideas, and stories that accumulate throughout the day as we work with our partners and each other to create social impact brands that help make the world a better place. We’ll shine a light on our process. We’ll share behind-the-scenes vignettes. We’ll capture and reflect on important moments when they happen. And we’ll do this with the mission of providing something meaningful and valuable for those who work in social impact strategy, design, and communications, in 500 words or less.
We’re excited to see what we generate—and hope you enjoy what we do!
Data visualization design is the process of taking a complex structure and breaking it down in a way that the reader can easily comprehend. It’s a powerful tool used to translate complex data into more understandable and accessible information that audiences can understand and relate to. Data visualization for nonprofits—particularly research-driven nonprofits—is an equally powerful way to strengthen communications—breaking down complex systems, dynamics, and situations so that they connect audiences to important social impact issues and ways to address them.
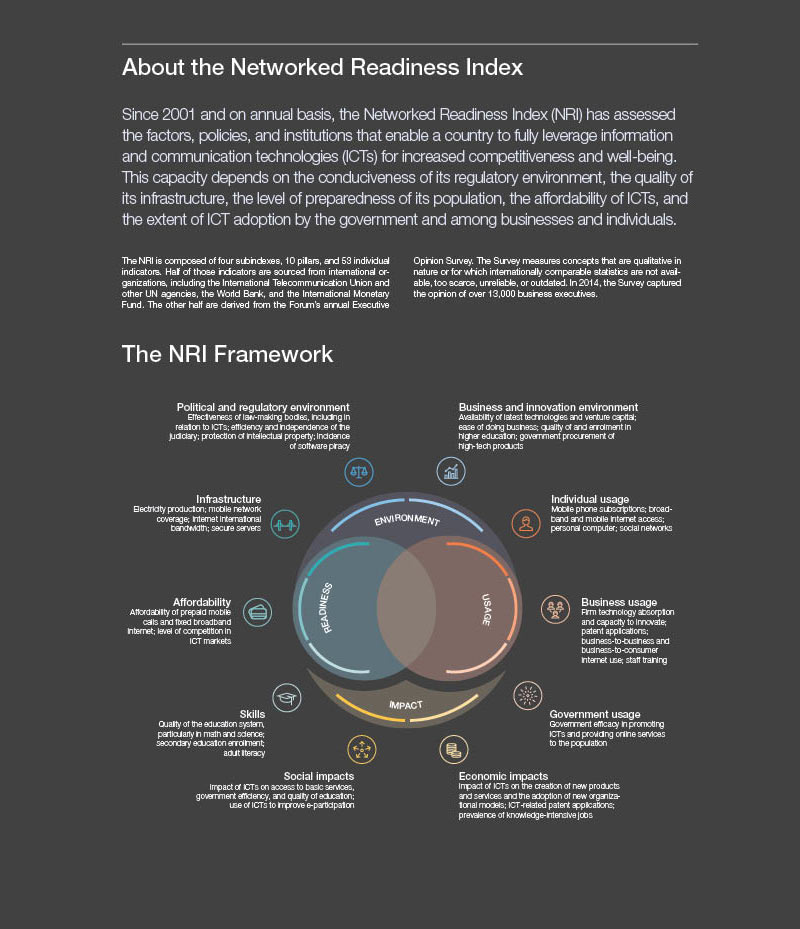
Recently, we were engaged by World Economic Forum to develop a series of data visualizations for several global issues. The content they gave us to work with was complex and needed to not only be simplified, but delivered in a compact format that would keep readers engaged. In this Field Note, we’ll explain the four critical steps we took to create a visualization to turn this complexity into simplicity to help World Economic Forum more effectively share its insights.
Step 1: Decipher the Data
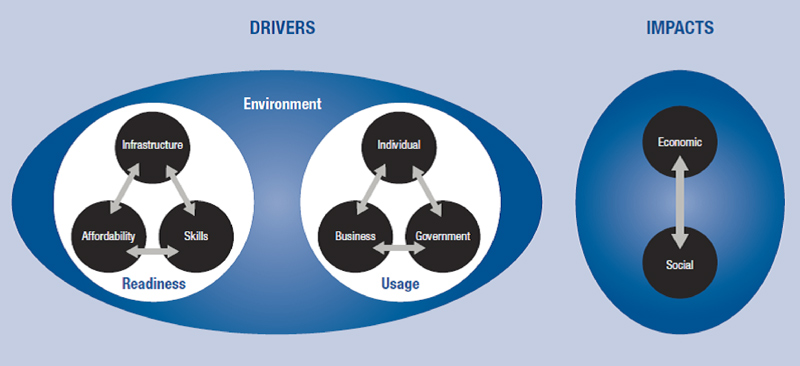
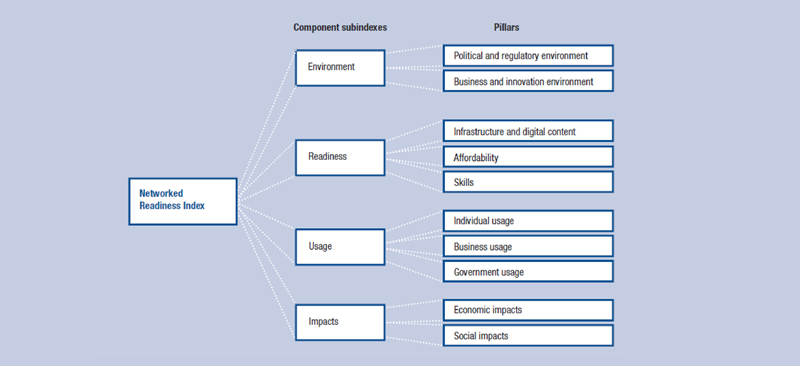
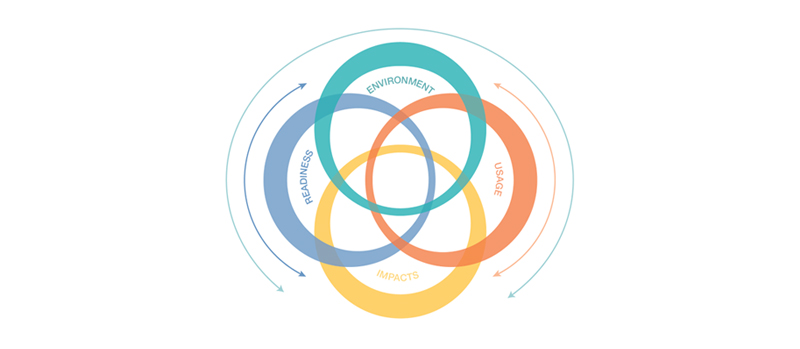
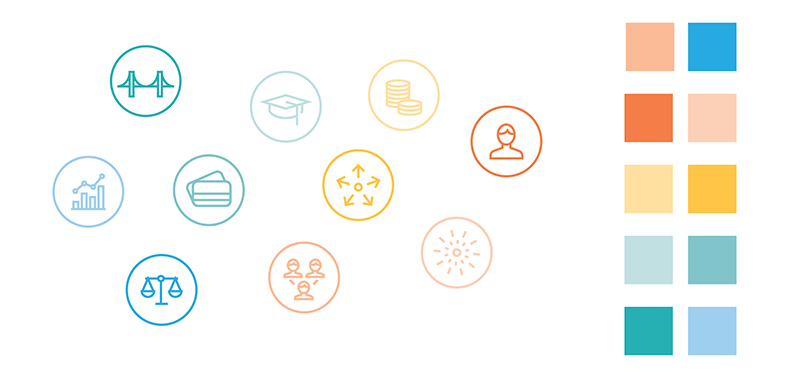
As with every design process, the first step in data visualization begins with establishing clear goals and then unpacking all of the information/data to understand how they can best support this goal. The priority is to unederstand what problem you are trying to solve and, from there, start to conceptualize a solution. In the case of World Economic Forum, our task was to decipher the data provided regarding The Networked Readiness Index (NRI). This is a complex global data set, comprised of four sub-indexes and ten pillars. The first two images are some of the information we were originally provided to design new data visualizations for. Our design challenge was to integrate both of these competing concepts into a singular visualization, which is displayed afterwards.
Step 2: Iterate…Iterate…Iterate
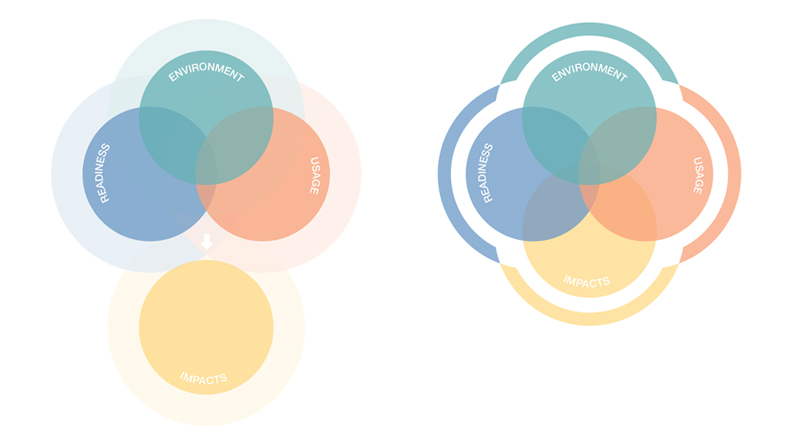
Iterative design in data visualization is essential because, when you’re working with complex research and information that needs to be communicated faithfully, you have to test assumptions before committing to a solution. We know that we very well may not get it right the first time—or even the second. We embarked on an iterative process exploring a variety of design structures before we reached a solution where the viewer could unquestionably discern the data. Design iteration allows us the opportunity to explore until we ultimately arrive at a solution that works.
There are many different types of graphs which can be used for data visualization. We explored two types for this project: the radial partition and the Venn diagram. The radial partition graph displays hierarchical data on a radial system by splitting up the sectors of a simple pie chart on different rings. Venn diagrams are specially designed diagrams that show all possible logical relations and capture the relationships between different categories and levels of information. Through the process of iteration, we discovered that the Venn diagram seemed to capture the information more accurately than the radial partition graph.
Step 3: Create a Graphic Narrative
Once we understood the message we needed to communicate, we then needed to create the visual language to articulate it. Curating the appropriate visual elements is critical, as the goal of any effective visualization is to allow the viewer to interpret information rapidly. A graphic narrative may contain a variety of visual elements. For example, color can be used as an indicator to accent data points or create classes of separation, and iconography can be utilized to support user comprehension. It is critical that whichever visual language you choose, it should always minimize the viewer’s time to interpret the data. The choice of visual representation, whether it is an illustration, icons, visual elements, or graphs, is that it is effective and aligns to telling the story accurately.
The goal of a graphic narrative should be to make a subject accessible to the user. It is about delivering clarity without diluting the data’s complexity. Rather, it should be made more digestible through elegant presentation.
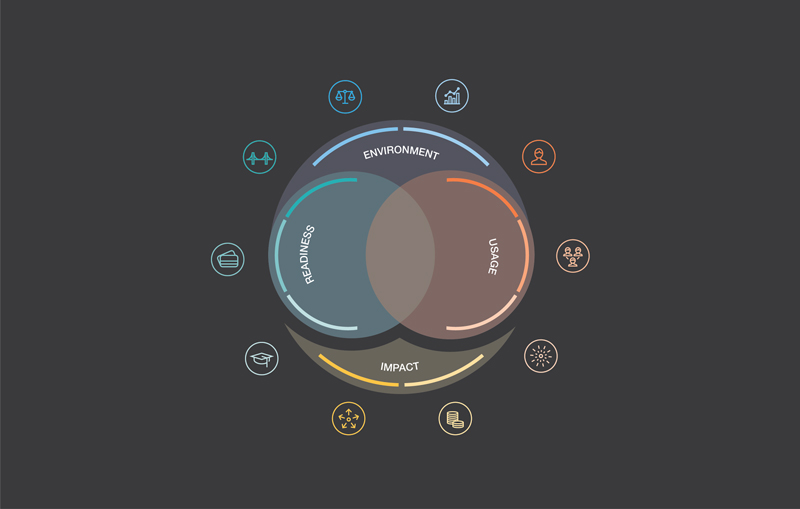
Step 4: Completion Checklist
A successful visualization should: a) clearly translate the message, b) reduce cognitive overload through visual language, and c) engage the viewer. In other words, the key for a successful visualization or infographic is to clearly and concisely tell the story. Here is our final visualization, which integrated the supplied sketches and included a Venn diagram and use of icons and color to communicate the framework for The Networked Readiness Index (NRI).