


If you’re a nonprofit looking for the best data visualization tools to communicate things like research data or social indexes, then welcome to Part 2 of our two-part series diving into data visualization tools. In Part 1 we took a close look at dimple, Plotly, and D3Plus. In this article, we’ll give you a closer look at three other great options: morris.js, NVD3, and vis.js.
morris.js

I didn’t think it was possible to get much simpler than dimple, but Morris manages to do it. Morris is pretty limited—aside from donut charts, it supports bar charts, times series, line, and area charts—but what it does, it does well. Based on Raphaël, Morris creates attractive interactive charts with a minimum of coding. For most charts, you just need to grab some data, tell it which field to use for the x axis and y axis, and line or area labels, and, voilà! You’ve got a chart.
You can customize your charts, setting colors, line widths etc, but even without any customization at all, you’ll get a good-looking chart.
- Visualization Types Supported: Pie Charts, Bar Charts, Line Charts, Area Charts
- Data Input Sources: JSON
- Data Output: SVG
Pros
Ease of Use
If you need something easier than Morris, you should probably be looking at SaaS tools like Plotly or Tableau. It’s hard to imagine that any downloadable javascript library could be simpler than this.
Attractive Charts
The default colors may be a little dull for some tastes, but they’re easy to change. And the charts are appealingly rendered by default, with nicely formatted tooltips.
Cons
Limited Options
Morris only offers a handful of charts, and its option list is less extensive than others.
NVD3
Yet another child of D3, NVD3 has closer ties to its parent than any chart we’ve looked at so far. It was inspired by an article by D3 developer, Mike Bostock on Reusable Charts, and while NVD3 charts aren’t all that difficult to implement, the D3 syntax may be off-putting.
NVD3 has some nice features built in, like clickable legends for line and bar charts that let users show or hide individual data elements, but there are also some gotchas.

For example, discrete bar charts let you stagger bar labels for a better fit, but too many bars on too small a screen can turn them into an unreadable mess.
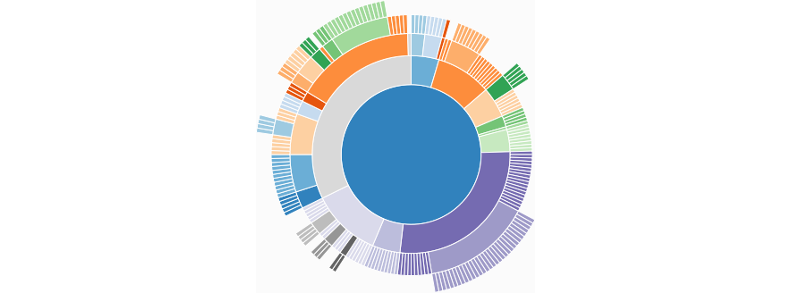
NVD3 has some charts that not even Plotly can offer, like the sunburst chart (shown above), and interactive sparklines. And thanks to myriad configuration options, even standards like donut charts can get a new look. If you’re willing to put in some extra time and effort, NVD3 will reward you with unique and beautiful charts.
- Visualization Types Supported: Simple Line, Scatter, Stacked, Area, Bar, Pie, Bullet, HTML Indented Tree, Monitoring, Sparkline, Parallel Coordinates, Candlestick OHLC, Sunburst, Box Plot
- Data Input Sources: JSON, CSV, TSV, anything D3 can process
- Data Output: SVG
Pros
Many Visualization Types
Besides the types listed above, NVD3 offers plenty of combinations and specializations such as scatter plus line charts, and time series bar charts.
A Multitude of Options
NVD3 offers a lot of built-in options for each graph type, including some nice features like noData, to add a message if data isn’t available — especially useful when users can filter data, or you’re using data from an external source which may not always be available, and id, which adds a CSS id to customize the appearance
Cons
Weak Documentation
Part of the reason that NVD3 is more difficult than similar libraries is down to poor documentation. The docs for some options simply say “No info for this option yet…”, so you may have to look at the example code to find out how they work. As of this writing, the docs aren’t on the main site (nvd3.org), but you can find them on Github, here.
A Work in Progress
The library is production-ready and most pieces are fine out of the box, but some areas still need some work, like the label issue I mentioned above. The good news is that this is a popular, actively maintained open-source project, so we can expect to see more improvements going forward.
vis.js
And now for something completely different…
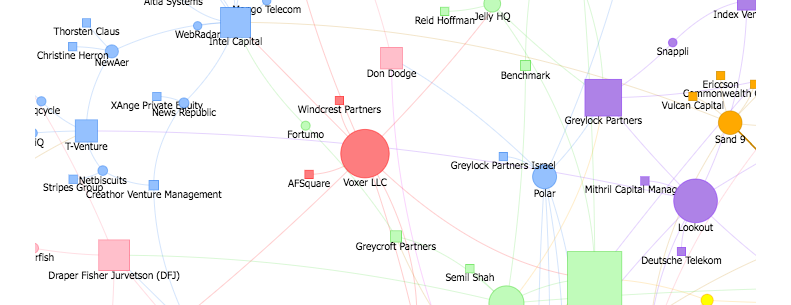
Vis.js does some of the basic charts we’ve seen in other libraries (line, bar, etc), but it also does a few things that are hard to find elsewhere: network diagrams and timelines.
vis.js isn’t very impressive when it comes to appearance. As with other packages, you can tweak and style them into good-looking charts, but it’s hard to justify the extra time and energy, when there are so many other libraries that give you a polished look out of the box. But while I can’t recommend vis.js for general charting, it’s worth a look for its network diagrams alone, so that’s what I’ll examine here.
Network diagrams are great for making connections, whether for hierarchical data like genealogy or organizational charts, routes such as airline maps, and interdependencies — the sky’s the limit. For more real-world uses, see vis.js’s own showcase of projects built with its library.
Like other members of the vis.js family, network charts are a bit plain-looking out of the box, but its features make it worth the extra time it can take to spruce them up. The network library lets you create groups, which make it easy to visually separate nodes by shape or color, and clusters, which expand or collapse a group of nodes and extensive event hooks for adding your own behaviors.
- Visualization Types Supported: Simple Line, Scatter, Stacked, Area, Bar (all regular and 3-D), Networks, Timelines
- Data Input Sources: JSON, DOT (for networks)
- Data Output: HTML5 Canvas
Pros
Built-in Behaviors
Network diagrams have some useful behaviors out of the box, like labels that grow, shrink, or disappear altogether, depending on the space available, and highlighting of connected edges when a user clicks a node.
Plenty of Options
vis.js also lets you choose from a variety of shapes for particular nodes or node groups, or replace them altogether with icons or images. You can add tooltips or use HTML in the node labels, making it easy to style and add links.
Choice of Date Formats
You can use json to import and/or calculate data, or use the DOT format to access Graphviz data or easily layout your own if you have a small dataset. For example, to create a triangle in DOT format you can write something like this:
A — B; B — C; C — A
where A, B, and C are the points of the triangle.
Cons
Slow Load Time
For networks with a lot of nodes, users have to wait a few seconds before the network appears. You can mitigate this by using clusters, but if you want to display all the nodes from the start, you’ll probably need some sort of ‘Loading…’ message, so users will know that there’s something there.
Conclusion
In this insight I’ve presented a set of libraries that cover a wide variety of chart types for a wide range of skill levels. But in terms of free charting libraries available, we’ve only scratched the surface, not to mention commercial libraries and SaaS products.
It’s also worth mentioning D3, which provides the basis for so many of these libraries. It still takes a fair bit of up-front investment in time to get a handle on the D3 language, but the library has gotten cleaner and more manageable over the years, so if you’ve found D3 too difficult in the past, it may be worth another look.
And of course, if you’re looking for someone to build you a website with attractive, user friendly and informative graphs, be sure to get in touch.
